Intermountain West Dashboard
Western Water Assessment needs your help improving the Intermountain West Dashboard! Please share your input in this short, anonymous survey which should take less than 5 minutes to complete.
The Intermountain West Dashboard provides situational awareness of weather, drought, and water resources for Colorado, Utah, and Wyoming.
Click the question mark icon above each graphic to see the description of that graphic.
Weekly or monthly summaries of evolving weather, drought, and water conditions for the Intermountain West are also available from these providers:
- Colorado CC/NIDIS Intermountain West Drought Status Briefings
- NOAA CBRFC Water Supply Briefings for the Colorado River Basin and Great Basin - monthly, January through May
- NRCS Water Supply Outlook Reports for Colorado, Utah, and Wyoming - monthly, January through May/June
Temperature, Precipitation and Snowpack


Drought Conditions


Current Streamflow, Forecasted Streamflow


Soil Moisture


Reservoir Storage


Precipitation Forecast

Seasonal Climate Outlooks


ENSO Conditions and Forecasts


Latest Briefing
October 8, 2025 - CO, UT, WY
September precipitation was mixed across the region, with below normal conditions in Utah and northeastern Wyoming, and above normal conditions in eastern Colorado and southeastern Wyoming. Temperatures were near to above normal for the majority of the region, with a large pocket of record-warm temperatures in southwestern Wyoming. The first snowfall of the season was observed on September 22 in Utah and September 23 in Colorado. Drought conditions remained the same in Utah and improved in Colorado and Wyoming, with regional drought coverage at 61% as of September 30. Monthly streamflow conditions were near to below normal across much of the region. The probability of La Niña conditions developing is 60% by mid to late fall. NOAA seasonal forecasts for October-December suggest an increased probability of below average precipitation and above average temperatures for the region.
The region experienced a mix of moisture conditions in September, with very dry conditions in western and northern Utah, and wet conditions in northeastern Colorado and southeastern Wyoming. Below normal precipitation occurred throughout most of Utah and northeastern Wyoming, while above normal precipitation occurred throughout most of eastern Colorado and southeastern Wyoming. A large pocket of record-wet conditions occurred in northeastern Colorado, and a pocket of record-dry conditions occurred in Johnson County, Wyoming.


September temperatures were near to above average throughout most of the region, except for pockets of 0 to 2°F below normal temperatures in southern Colorado and southern Utah. The majority of Wyoming and northern Utah experienced 2 to 4°F above average temperatures, with pockets of 4 to 6°F above average temperatures in northern and western Utah, and northern and western Wyoming. One small pocket of 6 to 8°F above normal temperatures occurred in Park County, Wyoming and an area of 2 to 4°F below normal conditions occurred in Las Animas County, Colorado. A large pocket of record-warm temperatures occurred in southwestern Wyoming.


The first snowfall of this snow season was observed on September 22 at 10,715 feet in Bald Mountain Pass on Mirror Lake Highway in Utah’s Uinta Mountains. On September 23, Colorado received up to 8.8 inches of snowfall, particularly east of the Continental Divide above 10,500 feet, with the most falling in Glendevey. As of October 1, all SNOTEL sites are reporting no accumulated snow. Here are the top five snowfall totals in Colorado from September 23:
- Glendevey, Colorado - 8.8 inches
- Arapahoe Peak, Colorado - 8 inches
- Cameron Pass, Colorado - 7.2 inches
- Berthoud Pass, Colorado - 7.2 inches
- Winter Park, Colorado - 7 inches
Drought conditions improved during September in Colorado and Wyoming, while all of Utah continues to remain in at least moderate (D1) drought. By September 30, regional drought coverage was 61%, a 6% improvement since the end of August. Colorado saw the removal of exceptional (D4) drought conditions on the West Slope and a 14% reduction in extreme (D3) drought. Wyoming also saw a 6% decrease in D3 drought conditions near Yellowstone region and in the south-central portion of the state. Coverage of extreme drought conditions in Utah decreased by 4% and severe (D2) drought declined by 4%.


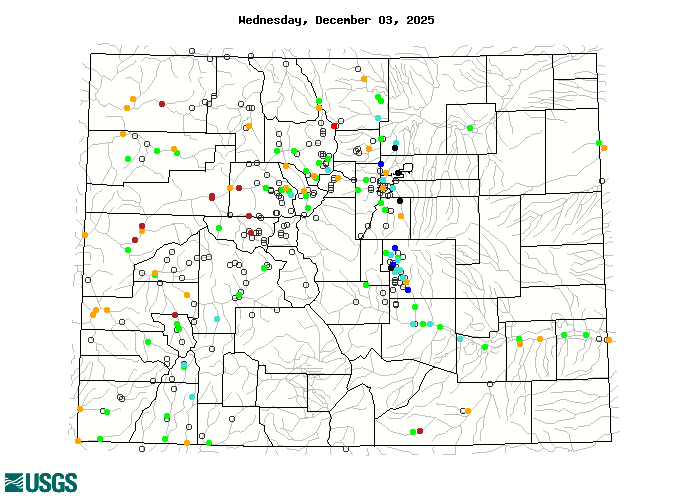
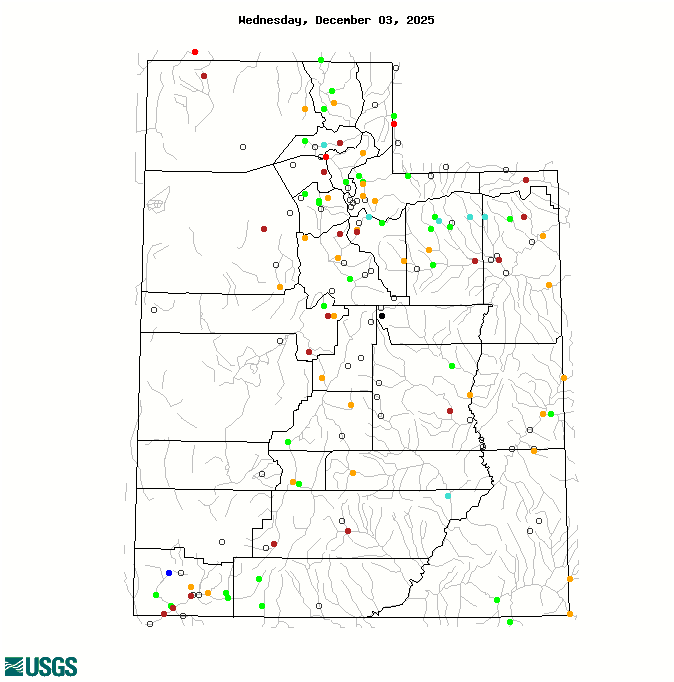
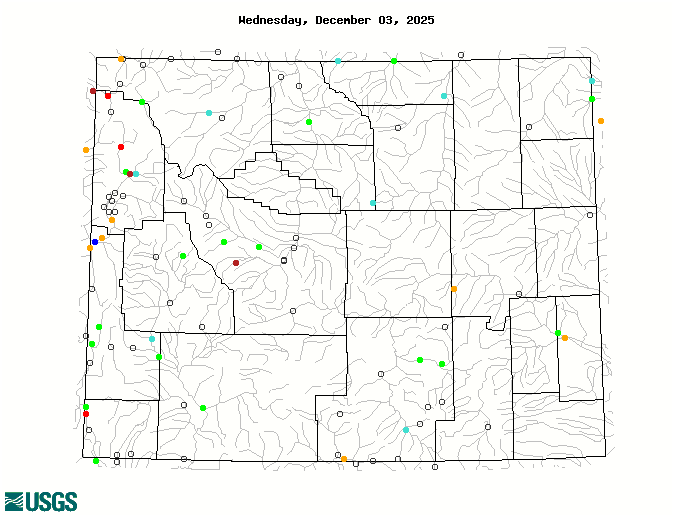
Monthly streamflow conditions were near to below normal across large parts of the region, with much below normal conditions in northwestern Wyoming and western Utah during September. Several USGS stream gages reported September streamflow conditions in the lowest 3% of all historical observations, including seven in Wyoming, six in Utah, and one in Colorado. While the majority of streamflow gages in the region reported near to below normal conditions in September, several gages reported above to much above normal conditions, particularly along the Front Range in Colorado. Additionally, a few USGS stream gages reported September streamflow conditions in the highest 96% of all historical observations, including two in Utah and one in Wyoming.


There is a 60% chance of La Niña conditions developing by November. By January, there is an equal probability of La Niña or neutral ENSO conditions and the probability for La Niña decreases throughout the remainder of winter 2026. The NOAA Monthly Precipitation Outlook suggests an increased probability of above average precipitation for northern Wyoming and below average precipitation for southeastern Colorado in October. The NOAA Monthly Temperature Outlook suggests an increased probability of above average temperatures for all of Colorado, eastern and central Wyoming, and southern Utah in October. The NOAA Seasonal Outlooks for October-December suggest an increased probability of below average precipitation in all of Colorado, southern and eastern Utah, and southeastern Wyoming, and an increased probability of above average temperatures throughout the region.


The Colorado River is in a water crisis as consumption continues to outweigh the natural supply each year. To stabilize the system, Colorado River Basin that water use must be balanced with natural river flows. According to the recent report, “Analysis of Colorado River Basin Storage Suggests Need For Immediate Action” (Schmidt et al. 2025) the basin currently has 6.3 million acre-feet of accessible water storage in Lakes Powell and Mead. If next year is a repeat of this year’s unforgiving hydrology and water use remains the same in the basin, Schmidt et al. estimate that consumptive use will exceed the natural flow in the river basin by at least 3.6 million acre-feet, leaving only 3.6-3.7 million acre-feet left in storage above critical elevations in Lakes Powell and Mead by late summer 2026. According to the report, depleting half of the basin's storage by the end of water year 2026 will leave water managers with limited flexibility when the new post-2026 operating regime comes into effect. To avoid this outcome, the basin requires immediate and substantial reductions in consumptive use.

Learn more: https://www.colorado.edu/center/gwc/media/670
Significant weather event: On September 23, Denver set a daily rainfall record of 1.28” of precipitation at Denver International Airport, making it the wettest September 23 since records began in 1872. Denver’s Central Park weather station recorded 1.33” of rain, making September 23 the wettest day since June 22, 2023 for Denver. This same storm brought heavy, wet snow to the high country, with the most snow reported at the Glendevey weather station in Larimer County at a total of 8.8” of snow (see above for the top five snowfall totals from September 23). Here are the top five rainfall totals from September 23 in Colorado:
- Central Park in Denver - 1.33 inches
- Denver International Airport - 1.28 inches
- Broomfield - 1.22 inches
- Fort Collins - 1.13 inches
- 9NEWS in Denver - 1.05 inches
Sources:
https://weather.com/news/news/2025-09-24-colorado-first-noticeable-snowfall-of-the-season
https://snowbrains.com/utah-mountains-receive-first-snow-of-winter-2025-26/
Water Year 2025 Summary
Precipitation during the 2025 water year was below average for all regional river basins west of the Continental Divide and precipitation generally ranged from 80-90% of average, except for the Lower San Juan basin which received 68% of average precipitation. Most river basins east of the Continental Divide received near average precipitation (Arkansas, Big Horn, North/South Platte, Powder and Yellowstone). The Belle Fouche and Cheyenne River basins in northeastern Wyoming received above average precipitation during 2025.


Temperatures were above average during the 2025 water year. The warmest temperatures were observed in Utah, western Colorado and southern Wyoming, where temperatures were generally 2-3 degrees above average. Temperatures were slightly above average (1-2 degrees) across much of Wyoming and central Colorado while eastern Colorado and northeastern Wyoming experienced near average water year temperatures.

Near average snow water equivalent (SWE) conditions were observed on April 1st for much of the northern portion of the region, while below to much below April 1st SWE conditions were observed in the southern portion of the region. April 1st SWE was near average in the Green, North/South Platte, Yampa-White, Colorado Headwaters, Bear, Jordan and Weber River Basins. Much below average SWE conditions were observed in the Dolores, Dirty Devil, San Juan and Rio Grande River Basins. Upper Colorado River Basin (UCRB) April 1st SWE was 87% average. Snowpack generally peaked in late March with a secondary, lower peak during early April and snowmelt occurred only slightly earlier than average except in the San Juan basin where snowmelt occurred nearly 2 weeks early.


Despite near average SWE conditions for many regional river basins, especially in the North, observed April–July streamflow volume was much below normal for all river basins. In general, streamflow forecasts worsened throughout the winter and during snowmelt. Observed inflow to Lake Powell was 41% of average; a particularly disappointing result considering April 1st SWE was 87% of average. Observed April-July streamflow in the Cheyenne, Lower Green, North Platte and White-Yampa was less than 60% of average despite near to above average snowpack. Every regional river basin experienced an inefficient runoff, where runoff was relatively low compared to snowpack. The poor runoff season can be partly attributed to lack of precipitation (in the South), early onset of snowmelt and extremely dry soils.


Drought conditions expanded significantly during the 2025 water year. The most significant change occurred in the Upper Colorado River Basin, where drought coverage of only 7% of the basin at the start of the water year expanded to 100% of the basin by the end of September 2025. Regionally, 36% of the region was in drought in October 2024; by late September 2025, 63% of the region was in drought, including 15% coverage by extreme drought which is mostly present in the Upper Colorado River Basin. Large areas of the Upper Colorado River Basin, predominantly in western Colorado, eastern Utah and southwestern Wyoming, experience a 3 to 4 category degradation in drought.


Surface soil moisture conditions were extremely poor at the start of the 2025 water year, with many areas experiencing soil moisture conditions in the less than two percentile range. After an extremely dry summer, surface soil moisture conditions improved during September across much of the region, with large areas of near average surface soil moisture and the area of low soil moisture anomalies was greatly reduced. Wetter soils near the surface may foretell the possibility of a better runoff season, however, the shallow groundwater drought index illustrates much drier conditions to end the 2025 water year. Much of southern Utah and western Colorado are experiencing exceptional shallow groundwater drought conditions.


Water storage in nearly all regional reservoirs declined during the 2025 water year. In general, reservoir storage is lowest in Colorado (49% of capacity) and highest in Utah (74% of capacity), with the greatest decreases in reservoir storage during 2025 occurring in Colorado. Many reservoirs in Utah remain at or well above median storage capacity, which is largely due to the lingering effects of the record 2023 water year in Utah. In general, reservoirs on the Upper Colorado River such as Blue Mesa, McPhee, Navajo, and Lake Powell have the lowest capacities. Water levels in Flaming Gorge Reservoir remain relatively high at 84% (94% of median capacity), however, extremely low water in Lake Powell means that additional releases from Flaming Gorge and perhaps other reservoirs will be needed to maintain electrical power generation at Glen Canyon Dam. Reservoirs on the Wasatch Front and in the Uinta Basin remain relatively full.


