Intermountain West Climate Dashboard
Western Water Assessment needs your help improving the Intermountain West Climate Dashboard! Please share your input in this short, anonymous survey which should take less than 5 minutes to complete.
The Intermountain West Climate Dashboard provides situational awareness of climate, drought, and water resources for Colorado, Utah, and Wyoming.
Click the question mark icon above each graphic to see the description of that graphic.
Weekly or monthly summaries of evolving climate, drought, and water conditions for the Intermountain West are also available from these providers:
- Colorado Climate Center/NIDIS Intermountain West Drought Status Briefings
- NOAA CBRFC Water Supply Briefings for the Colorado River Basin and Great Basin - monthly, January through May
- NRCS Water Supply Outlook Reports for Colorado, Utah, and Wyoming - monthly, January through May/June
Temperature, Precipitation and Snowpack
Drought Conditions
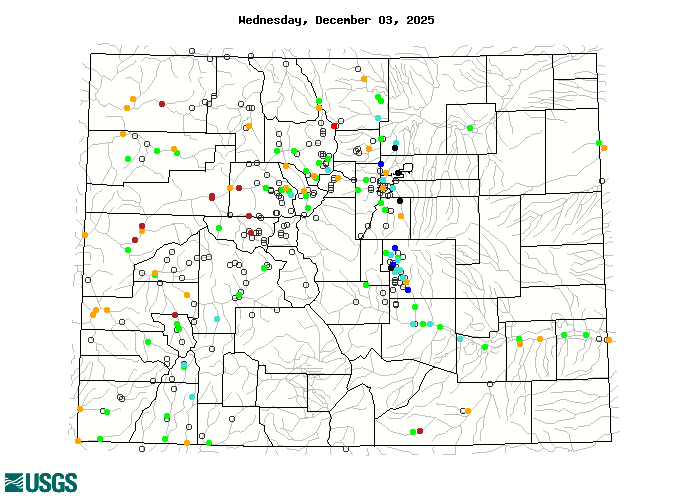
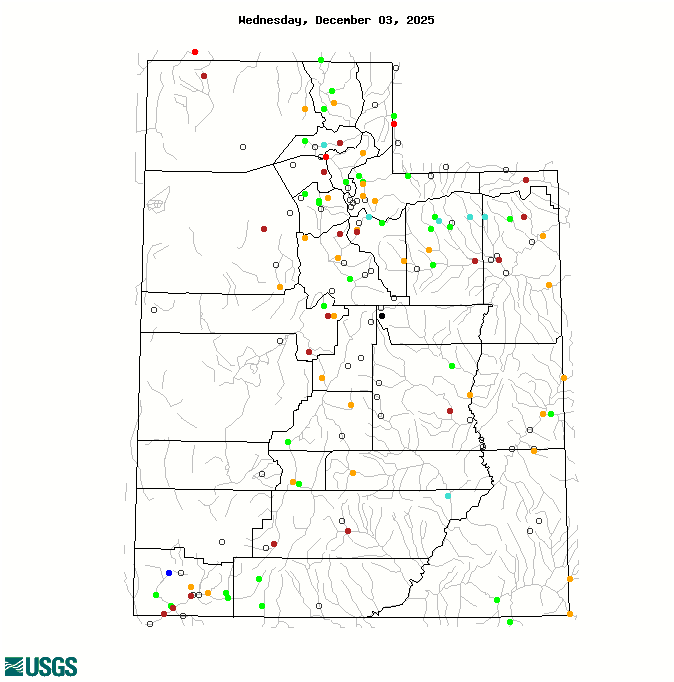
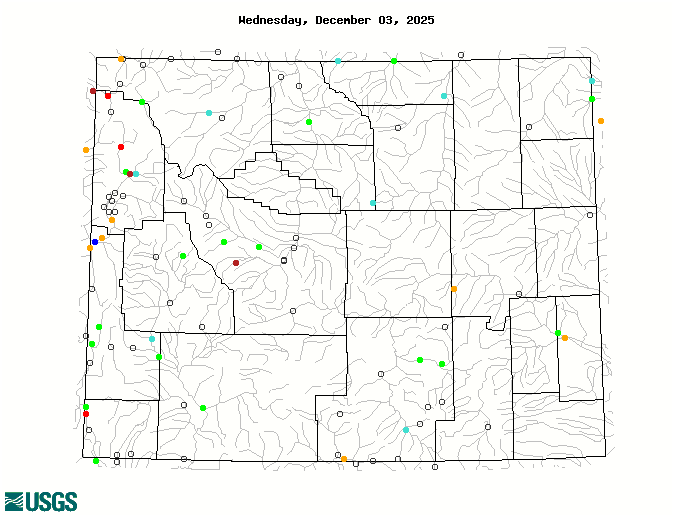
Current Streamflow, Forecasted Streamflow

Soil Moisture
Reservoir Storage
Precipitation Forecast
Seasonal Climate Outlooks
ENSO Conditions and Forecasts
Latest Briefing
Water Year 2024 Summary
Regional water year precipitation for 2024 was near normal. In Colorado, statewide 2024 water year precipitation was 101% of median, 99% of median in Utah and 94% of median in Wyoming. The two largest basins in our region also experienced near normal water year precipitation with the Upper Colorado River Basin receiving 99% of median precipitation and the Great Salt Lake receiving 105% of median precipitation. On a smaller geographic scale, 2024 brought near to above normal precipitation to northern Utah, central Colorado and northern Wyoming. Areas that were notably dry in 2024 include northeastern Colorado, southern Utah and eastern Wyoming.
Average temperatures during the 2024 water year were much above average for the entire region. The majority of the region experienced average temperatures that were up to 2ºF above average. Water year average temperature was 2-4ºF above average for several areas including southwestern Utah, eastern Utah, western Colorado and eastern Wyoming. Record high average temperatures during the last 9 months of the water year (January 2024-September 2024 were observed in Fillmore, UT and Laramie, WY. Several other small areas of record hot temperatures were observed throughout the region).
Snowpack in 2024 was near to above average for the entire region except for northeastern Wyoming where snowpack was much below average. Statewide April 1st snow water equivalent (SWE) was near or above average across the region with Colorado receiving 112% of average SWE, Utah with 132% of average SWE and Wyoming with 100% of average SWE. Snowpacks were deepest in the lower San Juan (288% average SWE) and the Dirty Devil River (152% average SWE) Basins and shallowest in the Belle Fouche (38% average SWE) and Cheyenne River (35% average SWE) Basins in northeastern Wyoming. Much of Colorado and Wyoming received near to slightly above average SWE. April 1st SWE was above average for all Utah river basins.
Despite near to above average snowpack throughout most of the region, April-July observed runoff volume ranged from slightly below average in the Wyoming river basins (Big Horn, Upper Green and Powder) and southern river basins (Dirty Devil, Dolores, Rio Grande and San Juan) to above average in the Great Basin (Bear, Great Salt Lake, Jordan and Weber) and Escalante River Basin. Much below average seasonal runoff was observed in northeastern Wyoming’s Cheyenne River Basin. The Weber River Basin observed the highest relative runoff at 132% of average seasonal runoff volume. A rough measure of runoff efficiency, or the proportion of snowpack that makes its way into runoff, was calculated as percent average of observed April-July runoff volume divided by percent average of April 1st SWE. Overall, regional runoff efficiency was relatively high with more than 90% of seasonal snowpack making its way into runoff in the Arkansas, South Platte, Yampa, Bear, Jordan, Price, Weber, Bighorn, Powder, Tongue and Yellowstone Rivers. Low runoff efficiency was observed in the Dolores, Rio Grande and Virgin River Basins. Low runoff efficiency in southwestern Colorado is likely attributed to continued long-term impacts of the drought that began in 2000.
The 2024 water year began with only 9% of the region in drought, largely due to the much above average 2023 water year. By the end of the water year, 36% of the region was in drought. Coverage of drought in Colorado and Utah remained relatively unchanged from the beginning to the end of the 2024 water year. Wyoming, however, experienced a sharp increase in coverage of drought; Wyoming was drought-free at the start of the 2024 water year, but 71% of the state was in drought by October 2024. Development of drought across Wyoming was driven by below normal water year precipitation across most of the state, especially eastern Wyoming, despite average April 1 snowpack conditions. Slightly above average water year temperatures likely exacerbated drought and the water year ended with July-September temperatures that were 2-4 degrees above average.
After a very wet 2023 water year, much of the region began the 2024 water year with soil surface moisture above the 80th percentile of NASA GRACE satellite observations, particularly in Utah, western Wyoming and southern Colorado. Areas with notably dry soil moisture to begin the 2024 water year included most of the Colorado Rockies, northeastern Colorado, southwestern Wyoming, and the Bighorn, Uinta and Wind River Mountains. By the end of the 2024 water year, surface soil moisture across most of the region was very low with most locations in the 5th percentile of all years of observation. Only south-central and northeastern Colorado has near average soil moisture conditions. Observations of near surface soil moisture (2” depth) from the NRCS SCAN network indicate similar patterns of wet soils to begin the 2024 water year, especially in the western portion of the region and very dry soils by September 2024. SCAN soil moisture observations indicated much below average soil moisture at the end of the 2024 water year for all river basins except for the Arkansas, Gunnison, Upper Rio Grande and Upper San Juan River Basins. Particularly troubling for the 2025 water year is extremely low soil moisture in the Upper Colorado (33% of median) and Upper Green River (28% of median) Basins.
Regional reservoir storage declined slightly from the beginning of the 2024 water year, but remains near median capacity. Reservoir storage is greatest in Utah where reservoirs are at 114% of median capacity, only slightly lower than in October 2023. Despite the onset of drought in Wyoming, reservoir storage is currently at 94% of median capacity, down from 103% in October 2023. The greatest declines in reservoir capacity were found in eastern Wyoming, especially in the Belle Fouche, Bighorn and North Platte River Basins. Storage in large Upper Colorado River Basin reservoirs remains near median capacity except for McPhee, Navajo and Lake Powell. Reservoir storage in Lake Powell was relatively stable during 2024 despite remaining at a low 38% of total storage capacity.
December 6, 2024 - CO, UT, WY
November precipitation was above average across central Utah and Colorado, much above average in eastern Colorado and below average across most of Wyoming, worsening the state’s drought conditions and low snowpack. Record 5-day precipitation totals in eastern Colorado aided in the removal of drought conditions. Regional temperatures were mostly below average, aiding the accumulation of snowpack, especially in Utah and Colorado where SWE conditions are average to above average. ENSO-neutral conditions prevailed in the Pacific Ocean during November and there is a 50/50 chance of neutral or La Niña conditions over the next few months.
Colorado, central Utah and southwestern Wyoming received above average November precipitation while southern Utah and much of Wyoming received below average precipitation. Precipitation was 150-400% of normal for the central Colorado Rockies and the Eastern Plains received over 400% of average November precipitation. Baca County in the southeastern corner of Colorado received over 800% of average precipitation during November. Large areas of eastern Colorado saw record November precipitation. Extremely dry November conditions prevailed in far southern Utah and much of Wyoming, especially in the northeast corner of the state.
November average temperatures were below average in Utah, Colorado and southwestern Wyoming and near average across the remainder of Wyoming. Most of Utah, Colorado and southwestern Wyoming saw November temperatures that were up to 4 degrees below normal, but pockets of 4 to 6 degrees below normal were found in central and eastern Colorado, central Utah and southwestern Wyoming.
December 1st snow water equivalent (SWE) was near to above normal in Colorado and Utah and below normal in Wyoming. Much above normal SWE conditions on December 1 were present in the Arkansas, Upper Colorado, Dolores, Gunnison and Rio Grande River Basins. Much below normal SWE conditions existed in the Big Horn, Cheyenne and Yellowstone River Basins. On a statewide basis, December 1 SWE was 129% of normal in Colorado, 107% of normal in Utah and 75% of normal in Wyoming.
November streamflow in most of the region’s river basins was near average. Above average streamflow during November occurred in the Arkansas and South Platte River Basins. Much below normal November streamflow (<10th percentile of observations) was observed at sites in the Bear, Escalante, Fremont, Madison, Ogden, Sevier, Weber and Yellowstone River Basins. Record low November streamflow was observed at one site in the Cache La Poudre River Basin.
November precipitation, especially in Colorado brought significant improvements to regional drought conditions. As of December 3rd, drought covers 42% of the region, down from 53% of the region last month. Much above average November precipitation in Colorado caused the removal of a large area of drought and a reduction in the area of extreme drought. Drought conditions also improved in central Utah and parts of Wyoming. Severe drought conditions in northwestern Wyoming expanded during November.
Sea surface temperatures in the Pacific Ocean during November remain consistent with neutral ENSO conditions. For the November-February period, there are near-equal chances of ENSO remaining neutral or weak La Niña development. By the February-April period, there is a 75% chance of ENSO-neutral conditions. NOAA seasonal forecasts for December and December-February indicate an increased probability for above average precipitation in northwestern Wyoming and an increased probability of below average precipitation for southern Colorado and southern Utah. During December, NOAA forecasts a high probability for above average temperatures. For the heart of meteorological winter, NOAA forecasts indicate an increased probability for above average temperatures in Utah and southwestern Colorado and an increased probability for below average temperatures in northern Wyoming.
A new forecasting tool is now available on the Intermountain West Climate Dashboard under the Seasonal Outlook tab. The Experimental Winter Precipitation Forecast provides a prediction of December-March precipitation for the western United States using a novel model that incorporates both Pacific Ocean (ENSO) and Atlantic Ocean (Atlantic Quadpole Mode or AQM) along with historical observations of seasonal precipitation. The most recent Experimental Winter Precipitation Forecast uses September and October sea surface temperatures and indicates average to slightly above average precipitation for much of the region. Below average December-March precipitation is forecasted for eastern Colorado and eastern Wyoming. The next forecast, which will use September-November sea surface temperatures, will be available in mid-December.
November significant weather event: Heavy rainfall in eastern Colorado. On November 5-9, a series of two slow-moving storms caused record 5-day rainfall totals in eastern Colorado. Record 5-day rainfall totals for November were observed at 14 sites in eastern Colorado with at least 50 years of weather data. The highest 5-day precipitation total of 5.93” was observed in Walsh, CO which is nearly a third of average annual precipitation and the third highest 5-day precipitation total on record for that site. Heavy precipitation in Colorado facilitated the removal of drought from a large portion of the state that included up to a 3-category improvement in drought conditions.


